A problem…
I have been working with RSI for a long time and tried using it in many ways. As a mean reversion indicator, trend following indicator, base for new indicators, and many more… So, after some time I realized that something was missing so I came up with a solution - Advantage RSI.
An introduction to Advantage RSI can be found here or we can use 3 seconds GIF to show the main differences between regular RSI and Advantage RSI.

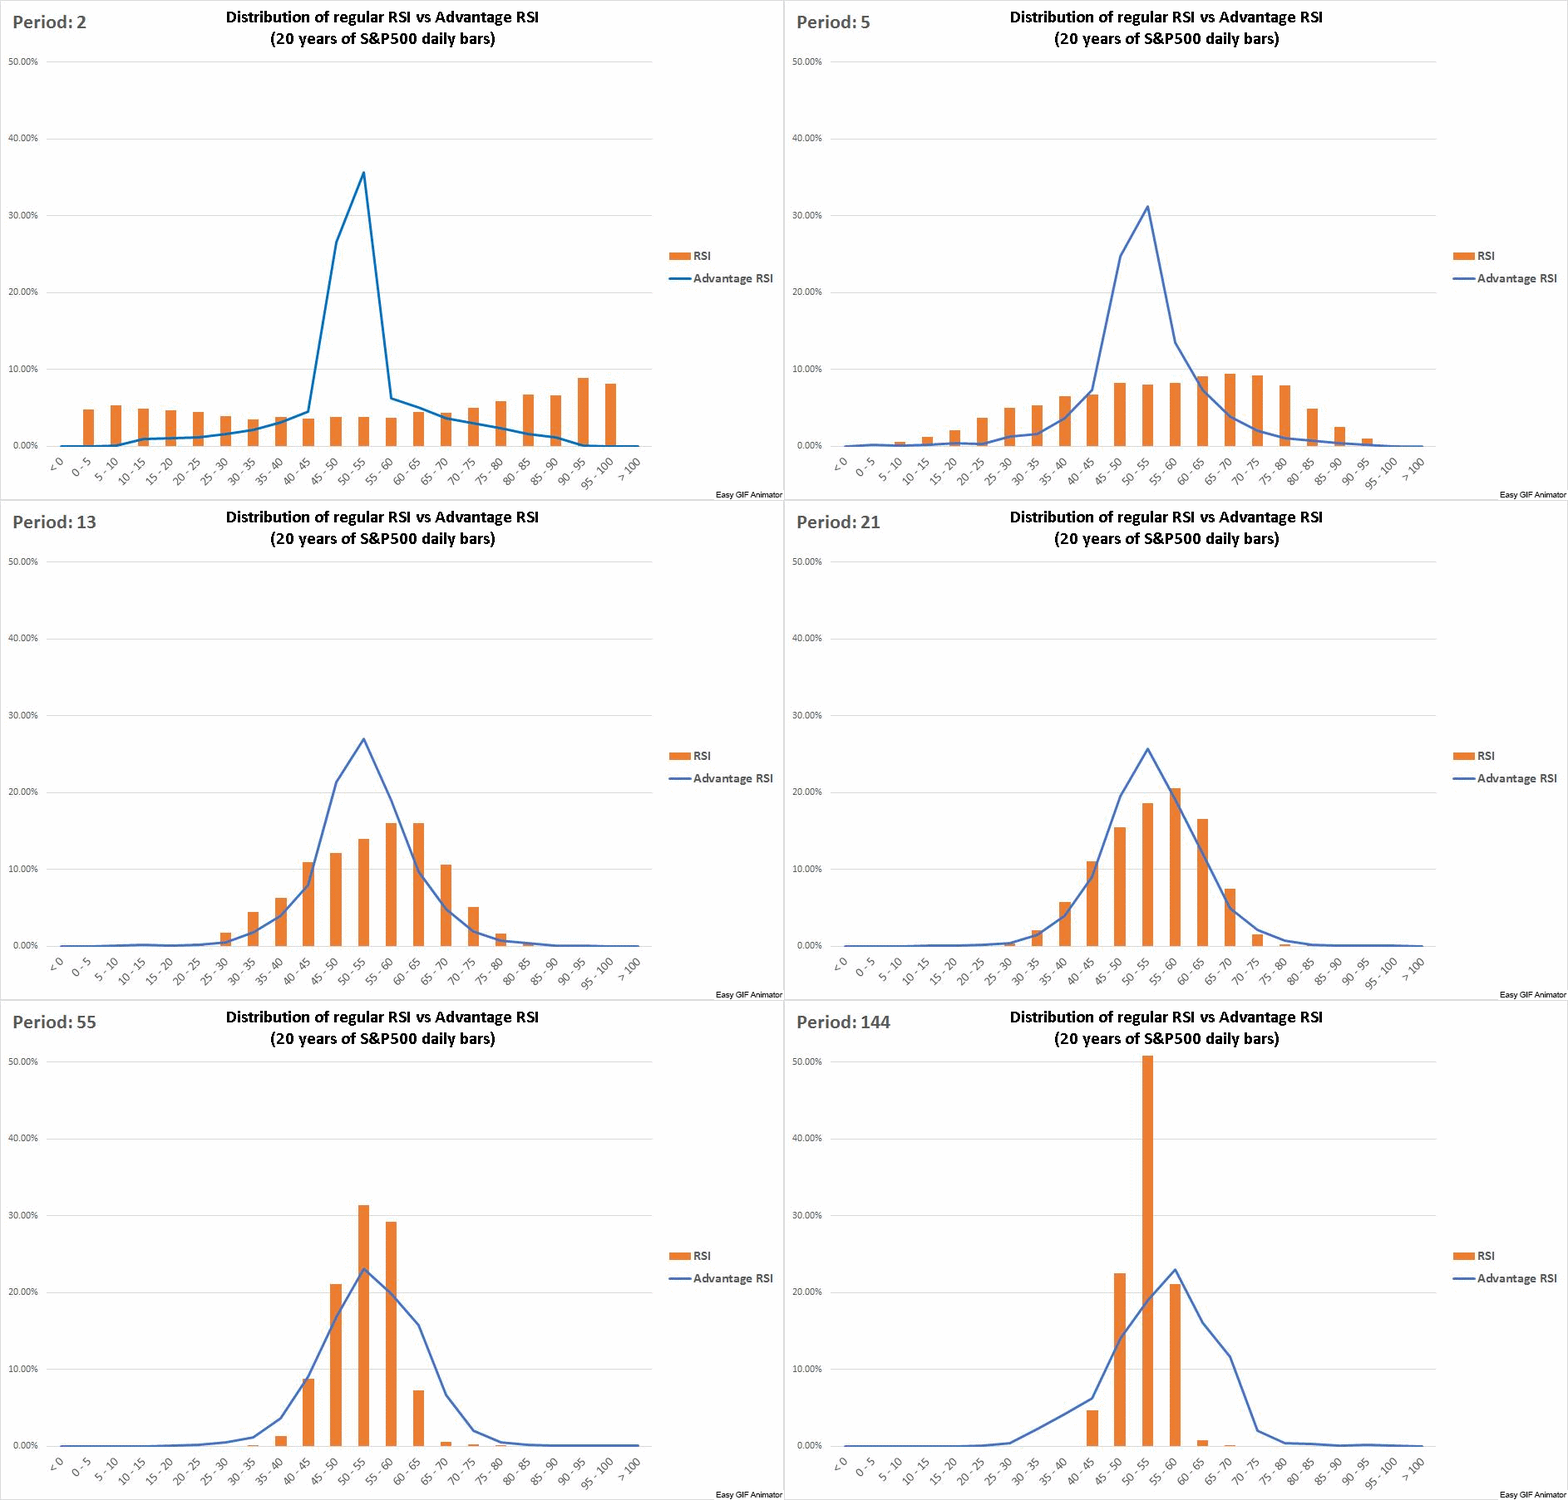
In regard to regular RSI I want to bring attention to two totally different types of distributions. “V”-shaped distribution for RSI(2) readings and “I”-shaped distribution for RSI(144). Obviously they are not perfect, but in general, most RSI(2) readings are either close to 0 or 100 points opposed to most of RSI(144) readings which are clustered very close to 50 points. So it turns out, that for a trader trying to apply normal distribution rules (the logic of 70-point being overbought and 30-points being oversold) to these kinds of distributions everything else but RSI(14) is useless.
So that’s why traders almost never go beyond RSI(14)…
People wrote hundreds of pages about 1 setting of 1 indicator. Have you ever seen 100 pages of trading techniques based on a 14-period exponential moving average?! Probably not, but you can find many pages on trading RSI(14). Why? Because not many bothered to go deep, to the very bottom of the problem.
…and an answer
There are two things that differentiate Advantage RSI from regular RSI: it is free and normalized. Free means that it is no longer constrained between 0- and 100-point lines. Going beyond 0-100 range will not happen very often, but when it does, it will mean that (in a given timeframe) trading conditions are exceptional.
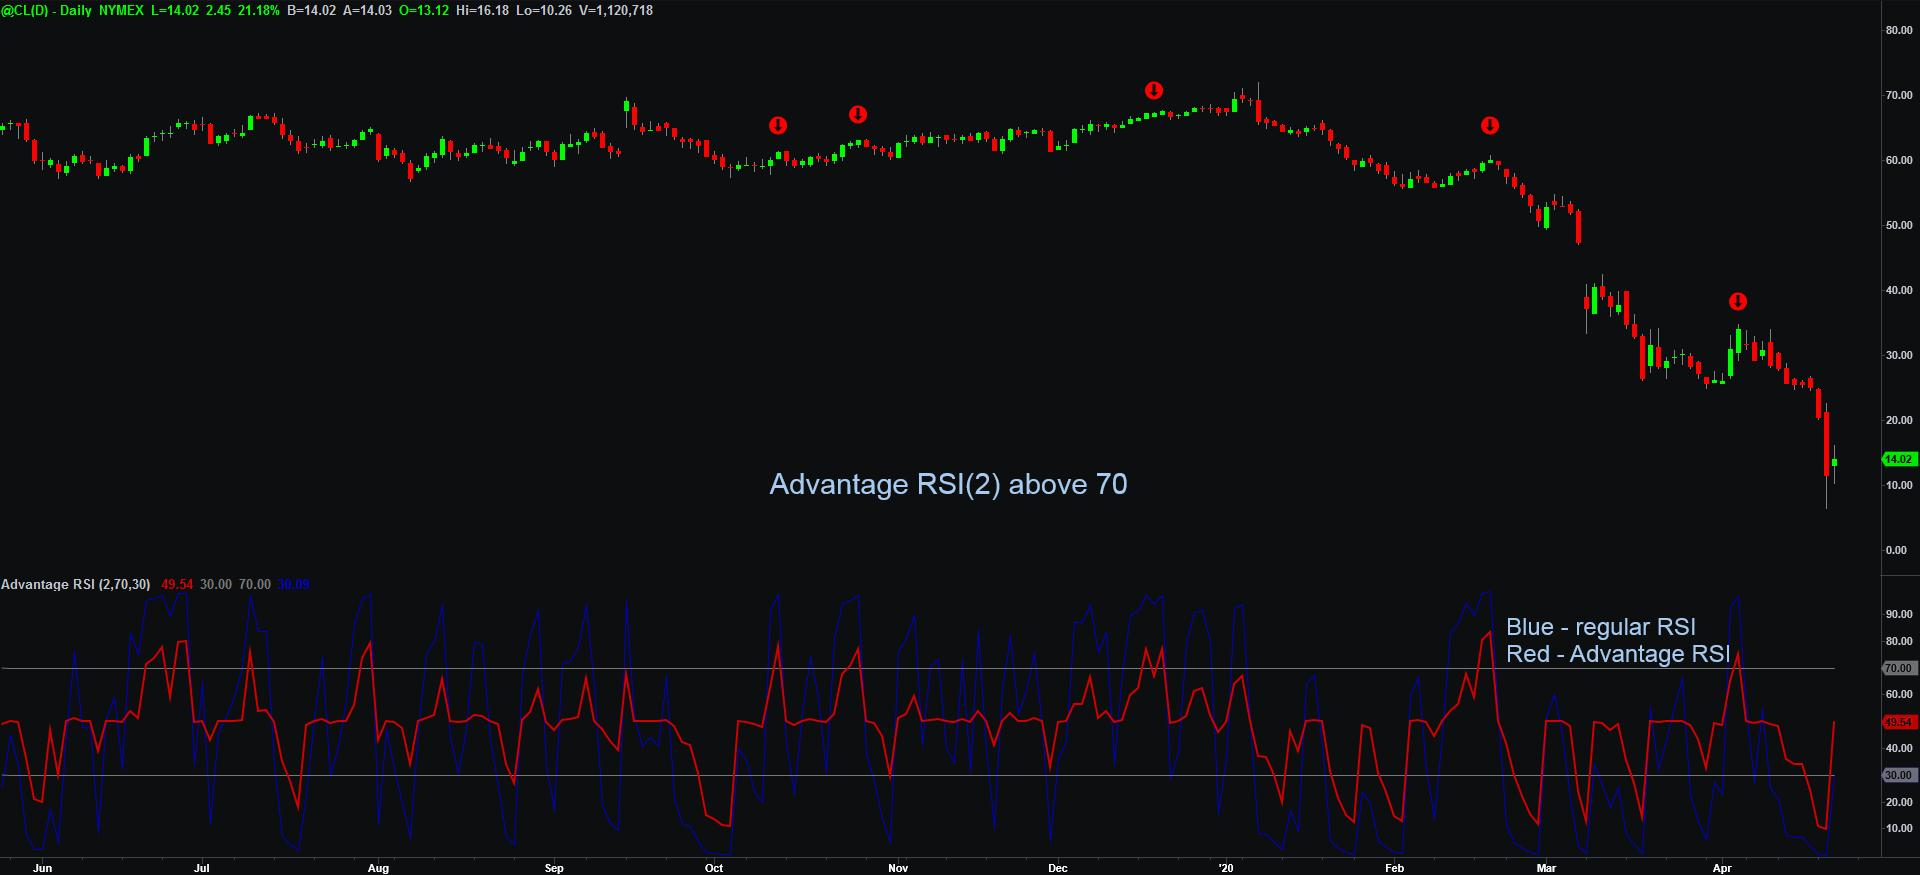
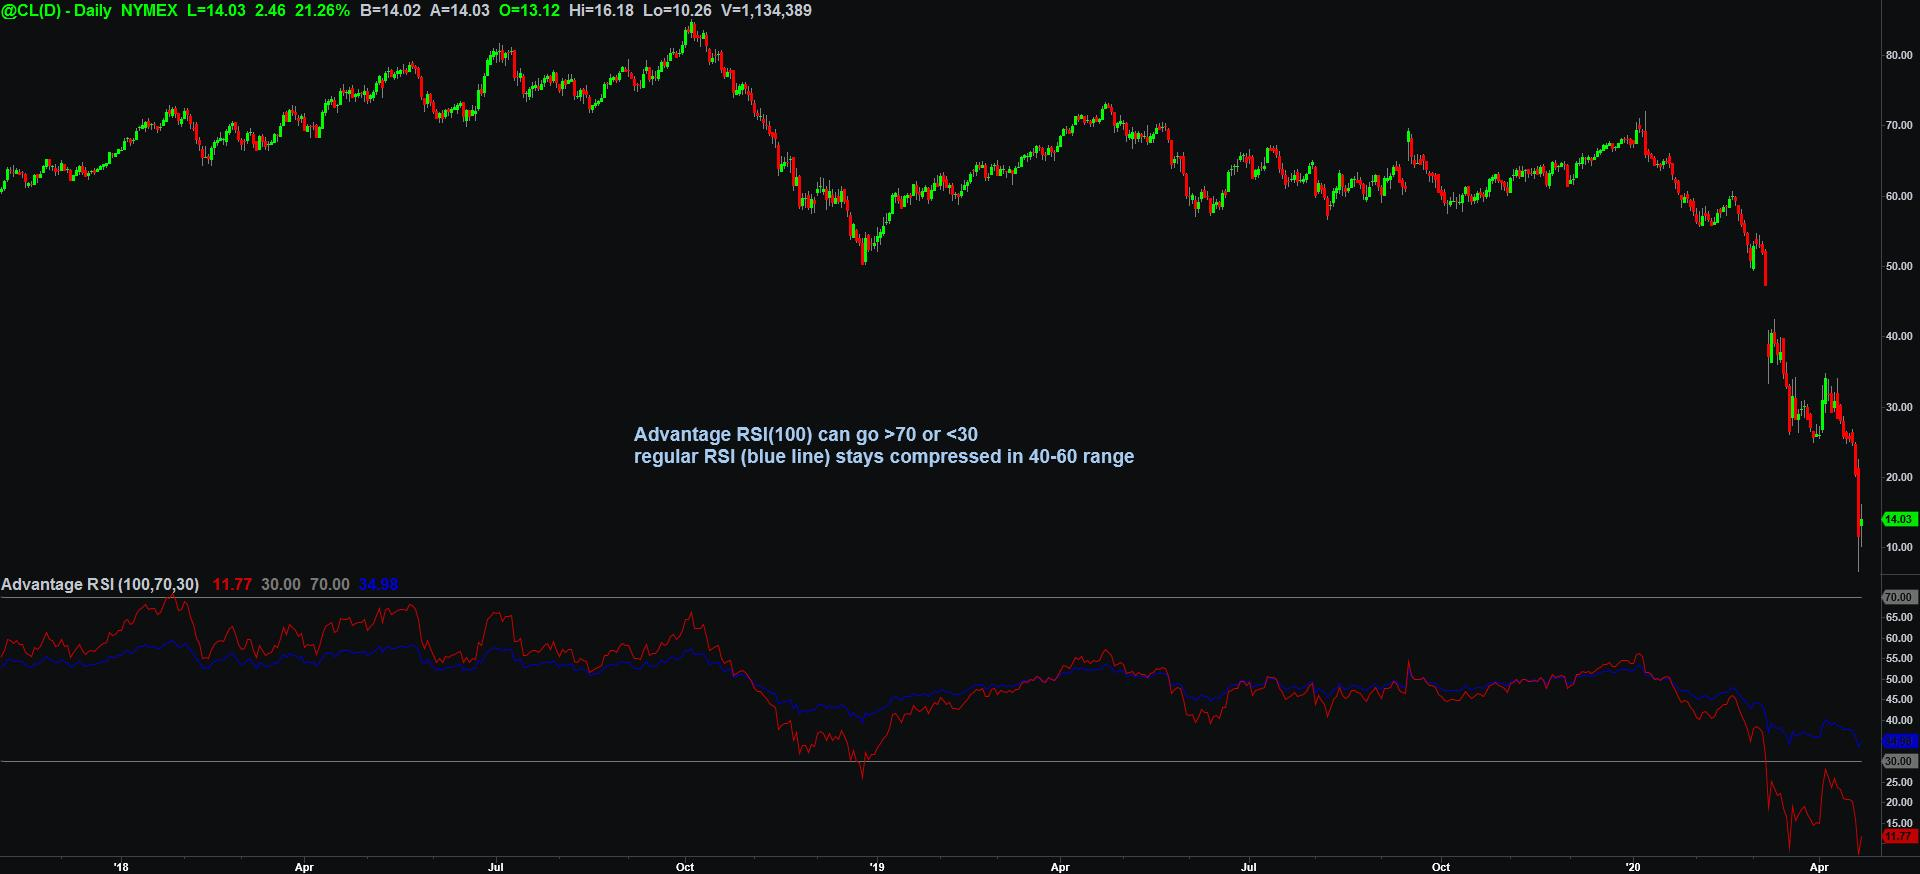
Wikipedia describes normalization as a process of “…adjusting values measured on different scales to a notionally common scale, often prior to averaging…”. To make it easier we only provide 2 examples: one for extremely short term (2), and one for the long term (100).
Getting normalized readings from different time frames is crucial to either average or compare them, to get the full picture of current market conditions. Also, the trader can finally use short term time frames to really pinpoint turning points without all the noise of regular RSI.
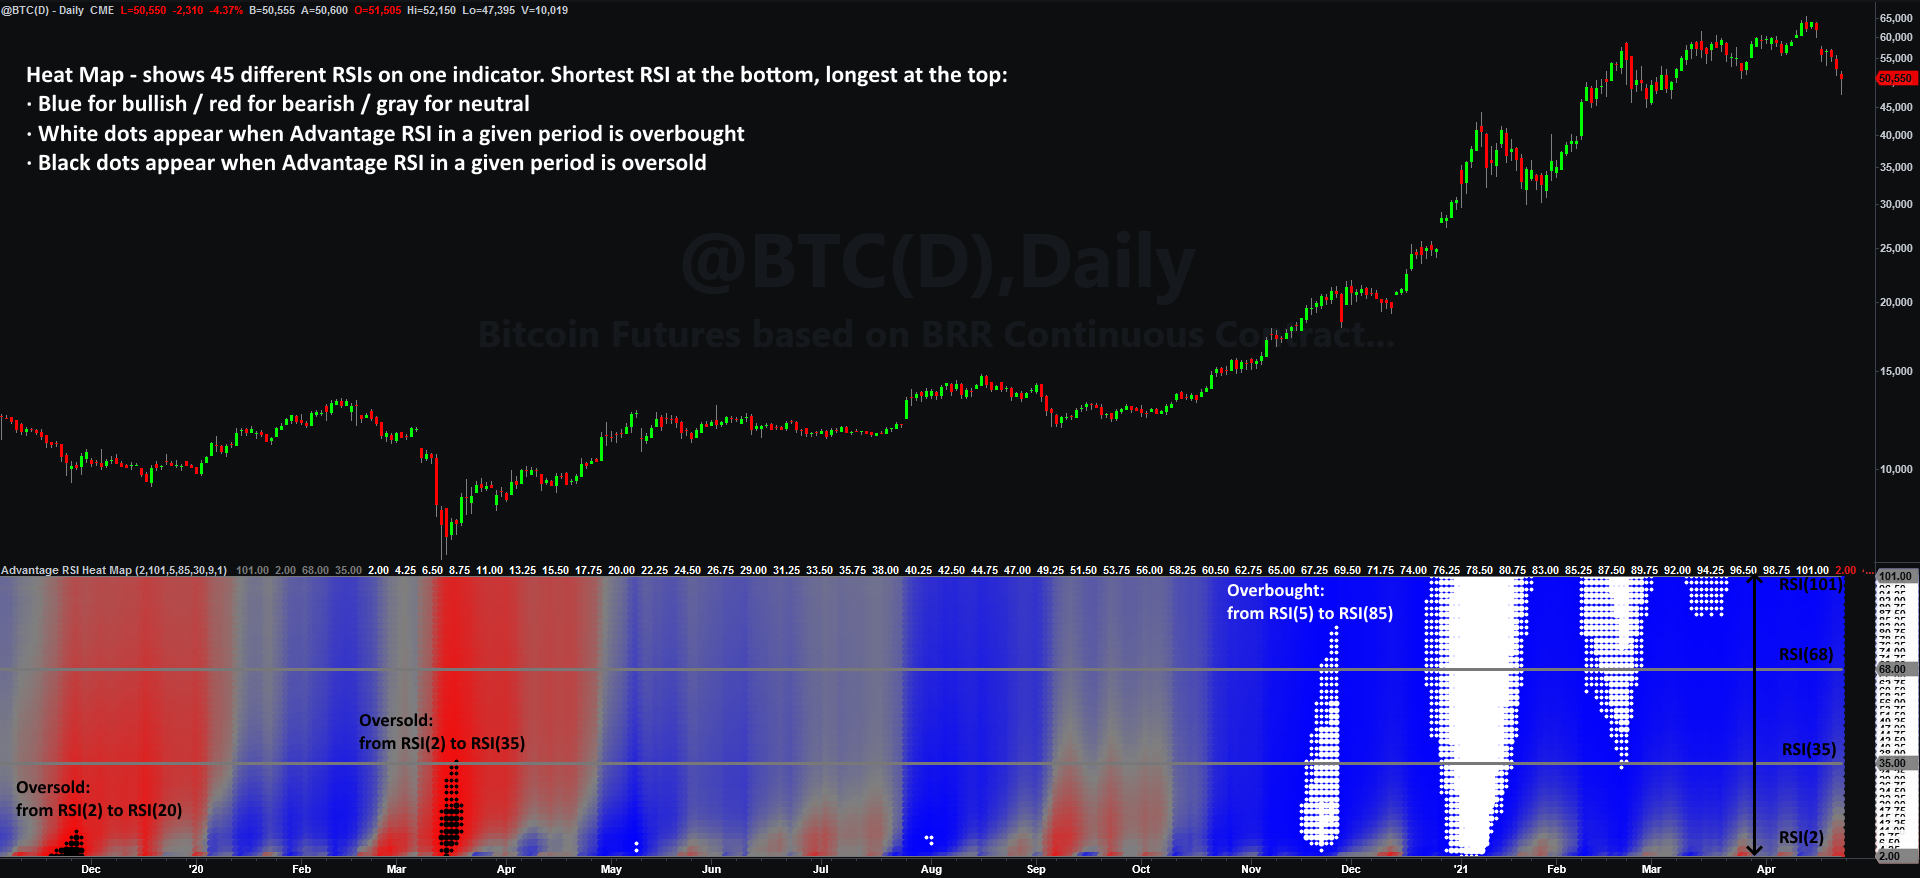
Averaging is used to create Ultimate indicator and Ultimate PaintBar, and comparing made possible the creation of Heat Map, which allows plotting 50 different time frames in one clear picture.
So making a long story short – Advantage RSI is an analytical tool that removes lots of noise, shows real multi-period strength or weakness, and helps to pinpoint major turning points. From short to long term.


