RSI: Uncommon approach to a common oscillator
How to use it properly
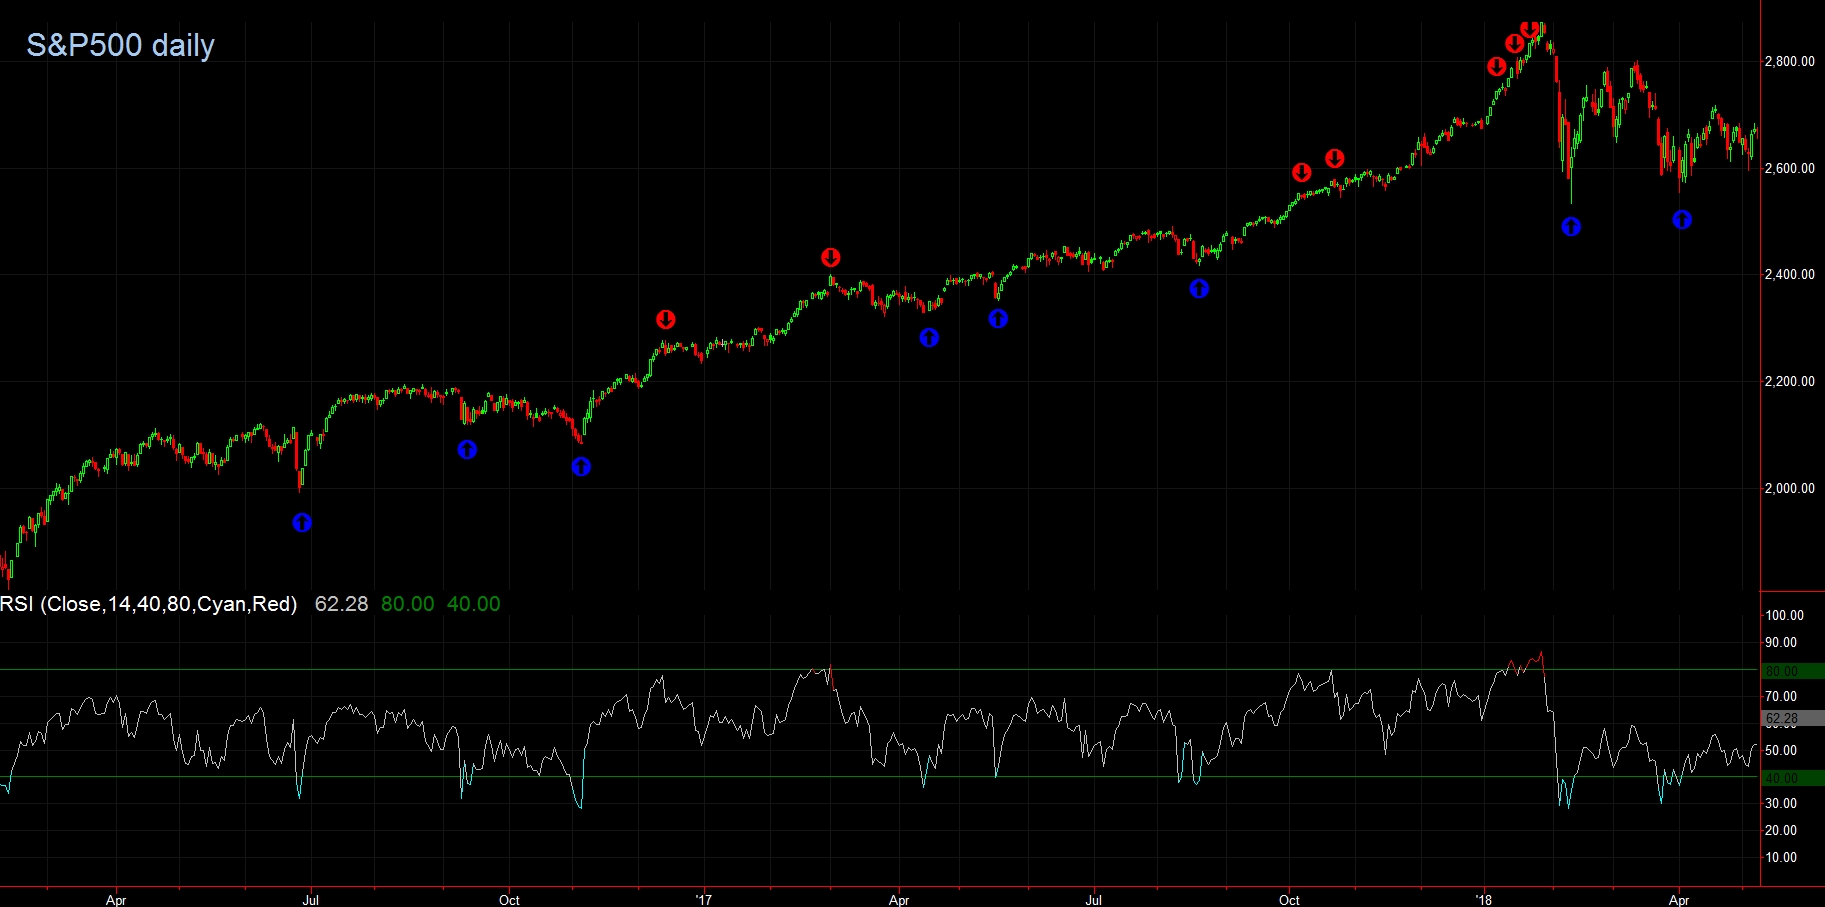
RSI is a good technical indicator. When used properly it shows dominant market trend and also shows zones for potential local tops in uptrend (bottoms in downtrend) and zones to look for the ends of corrections. So most people use RSI(14). Probably not because they like the number, but because they got used to it and they get puzzled by readings from shorter or longer period lengths. But let’s stay with RSI(14) and S&P500 for a while. Chart below shows distribution of RSI(14) readings grouped in pools of a size of 5 points: 0 to 5, 5 to 10, 10 to 15, and so on. 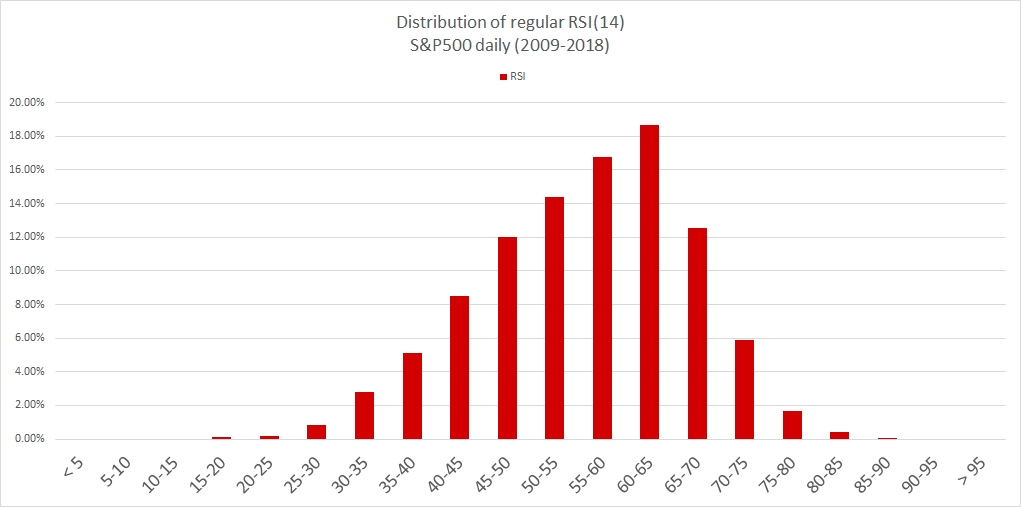
At first we see right skew, that is caused by strong uptrend (we discussed it at the beginning). Another thing is that approximately 35% of all readings fall between 55 and 65. Lastly we get 9% below 40 out of which 1% point is below 30. So again, if we use RSI like we were told to in the books, we would almost never get a buy signal that in a bull market we wait for. 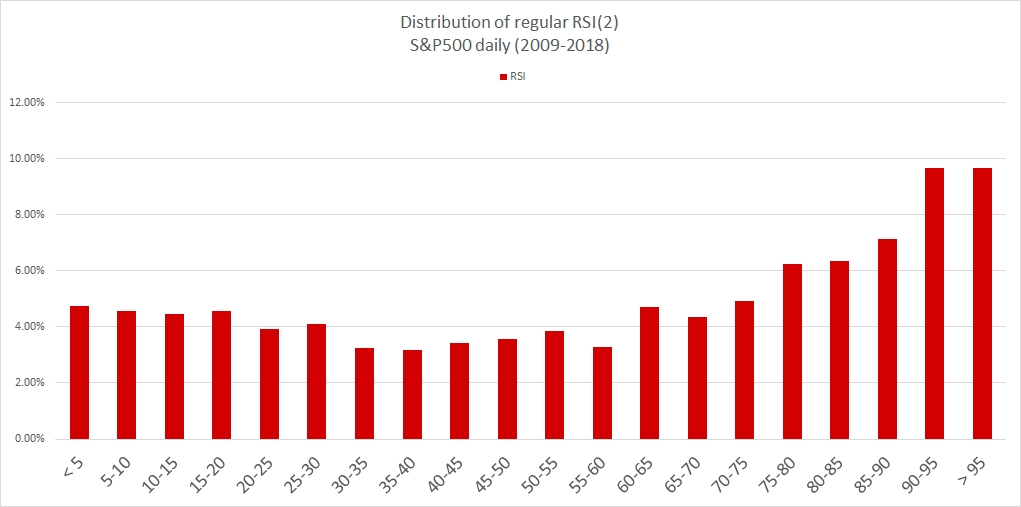 RSI(30): 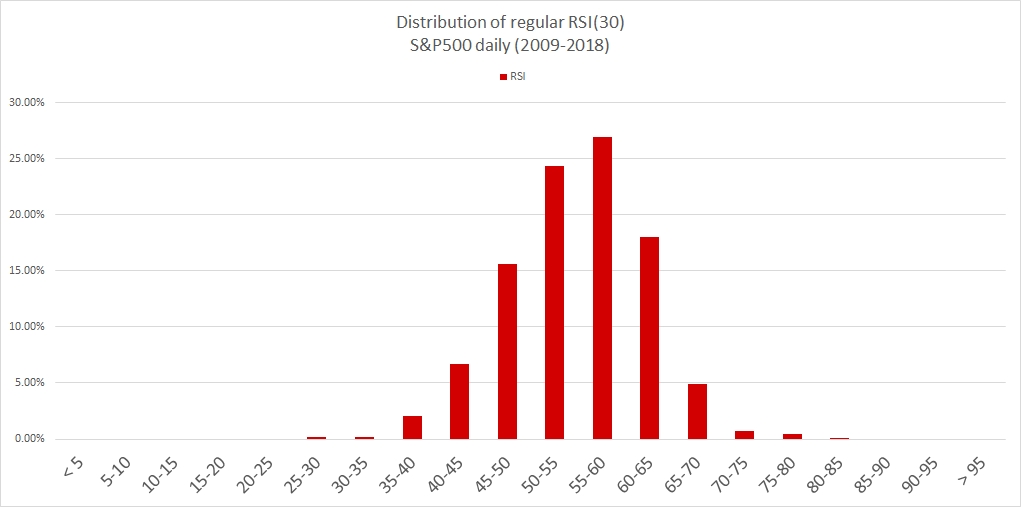
The only thing these distributions have in common is skew to the right (uptrend). Besides that there is not much a trader can get out of it. And the worst thing to do is trying to average or compare the readings of short and long term trends visualized by RSI. So coming back to the question why people don’t use different RSI lengths but RSI(14)…? Probably because they don’t see any benefits in doing so, and are so used to normal distribution, that anything different is just too much to handle. 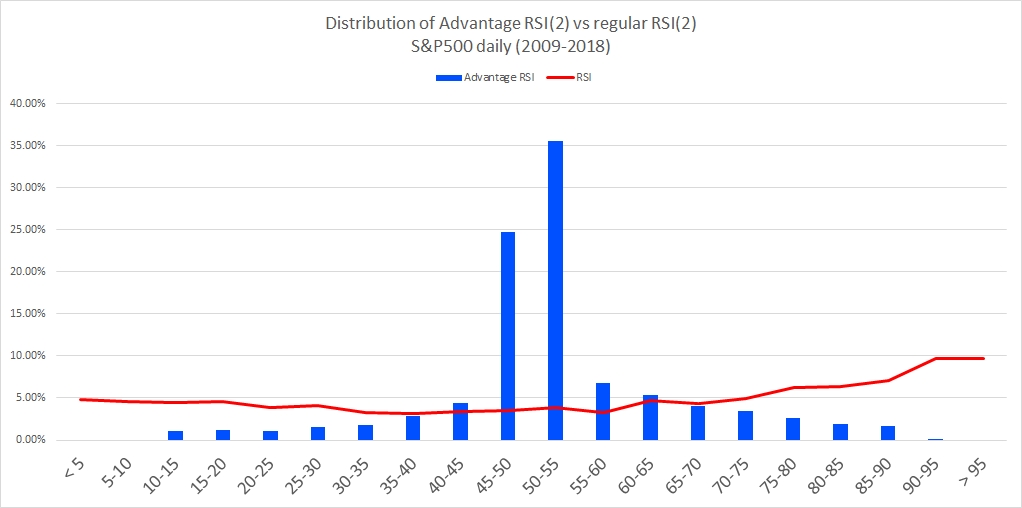 RSI(14): 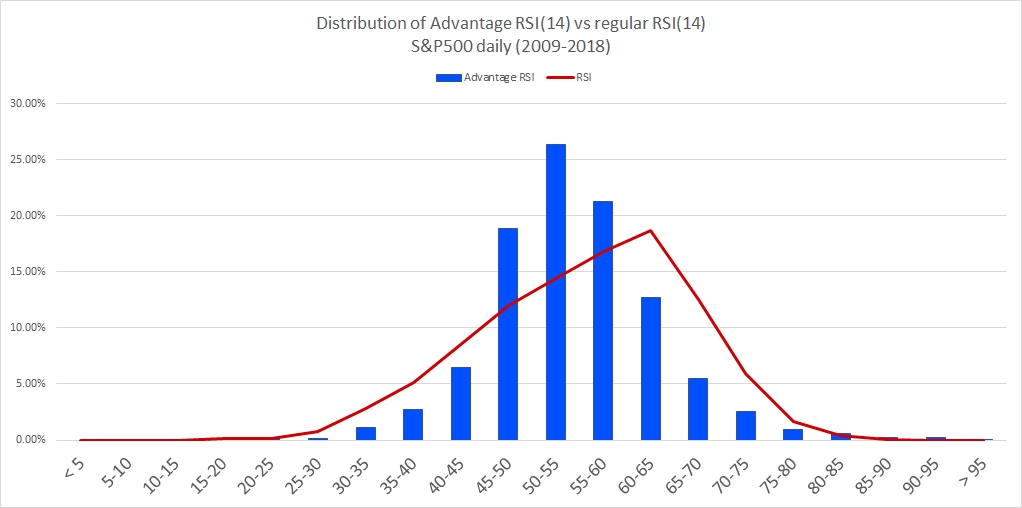 RSI(30): 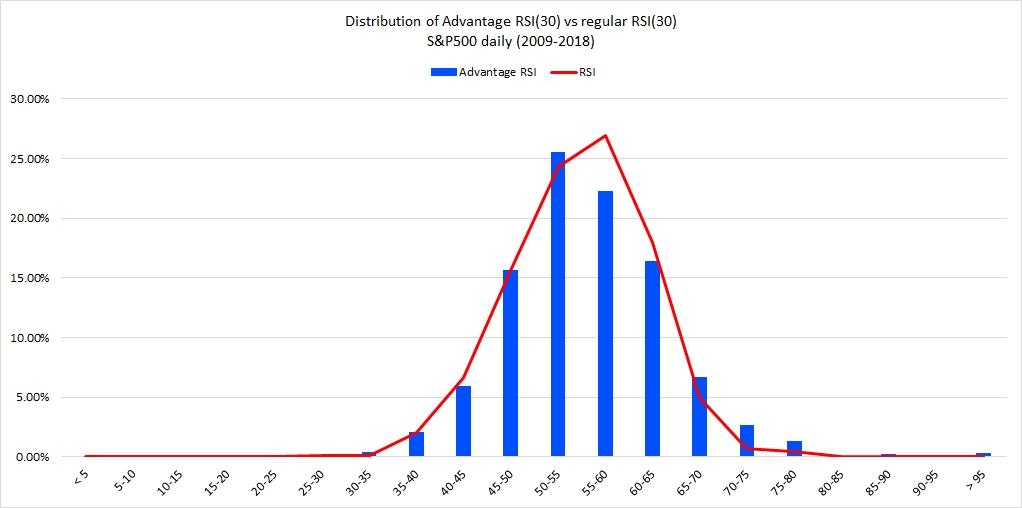
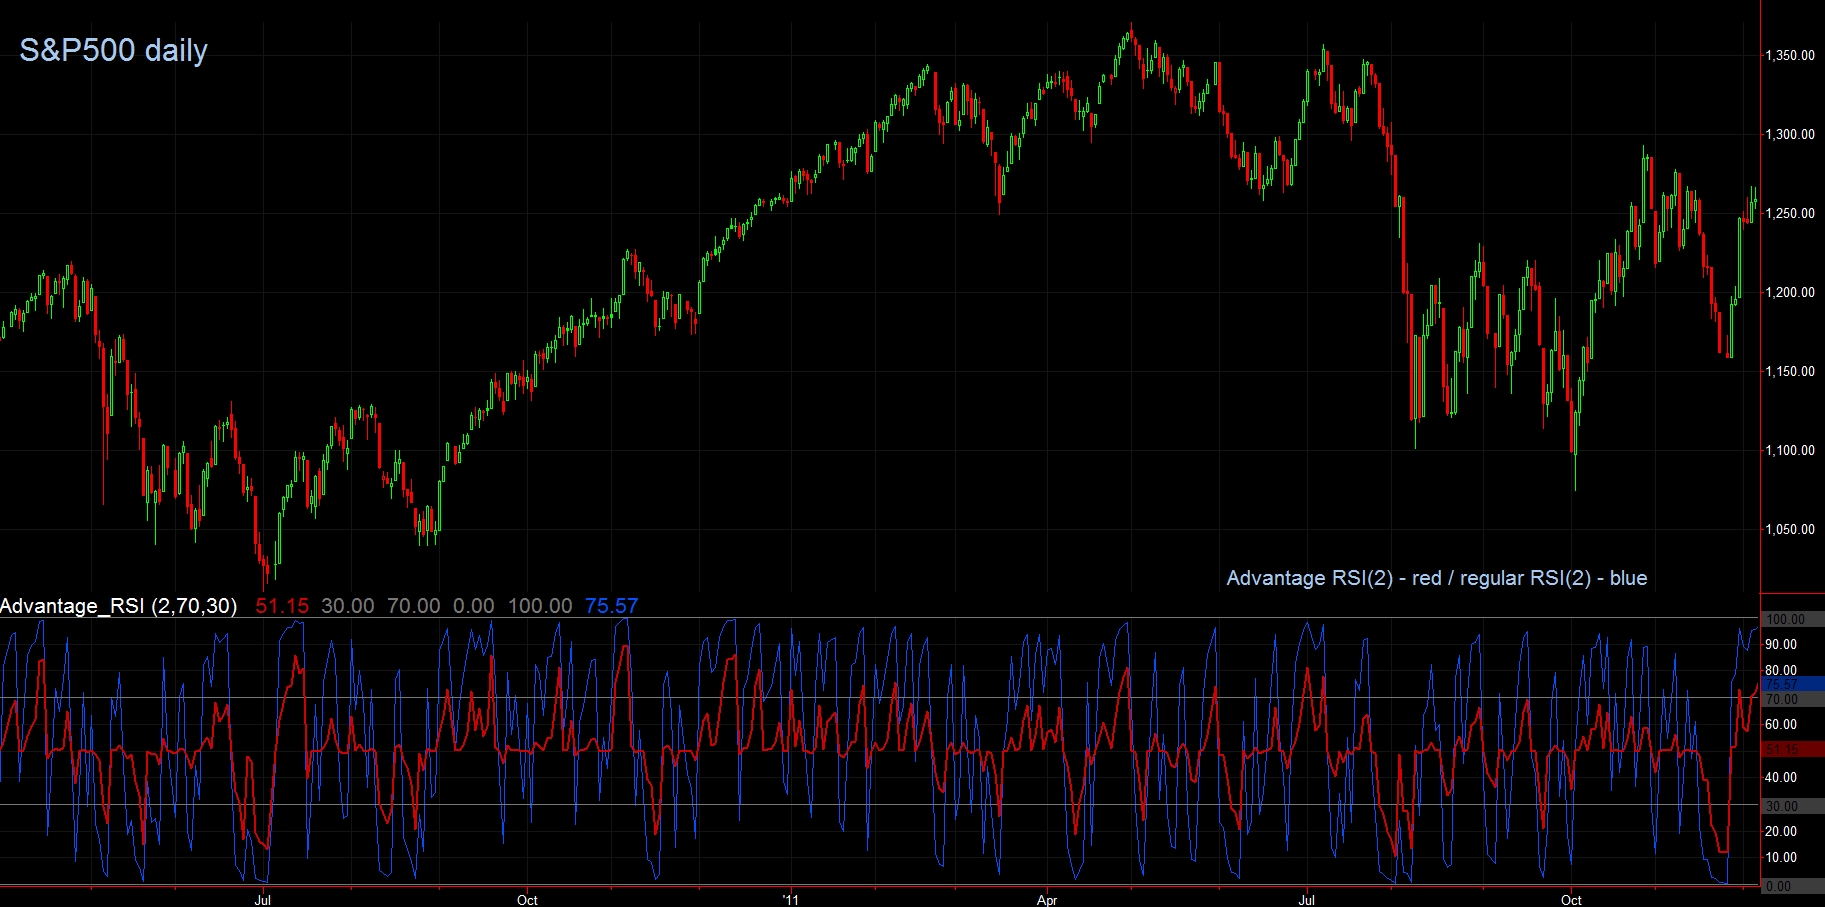
There are two main differences between regular RSI and Advantage RSI:
With longer period lengths, at first glance, we get pretty much same distribution. Or at least so close not to care. They are distributed closer to the center and still have readings in lower/upper zones, but probably no one would even notice it from distribution charts.
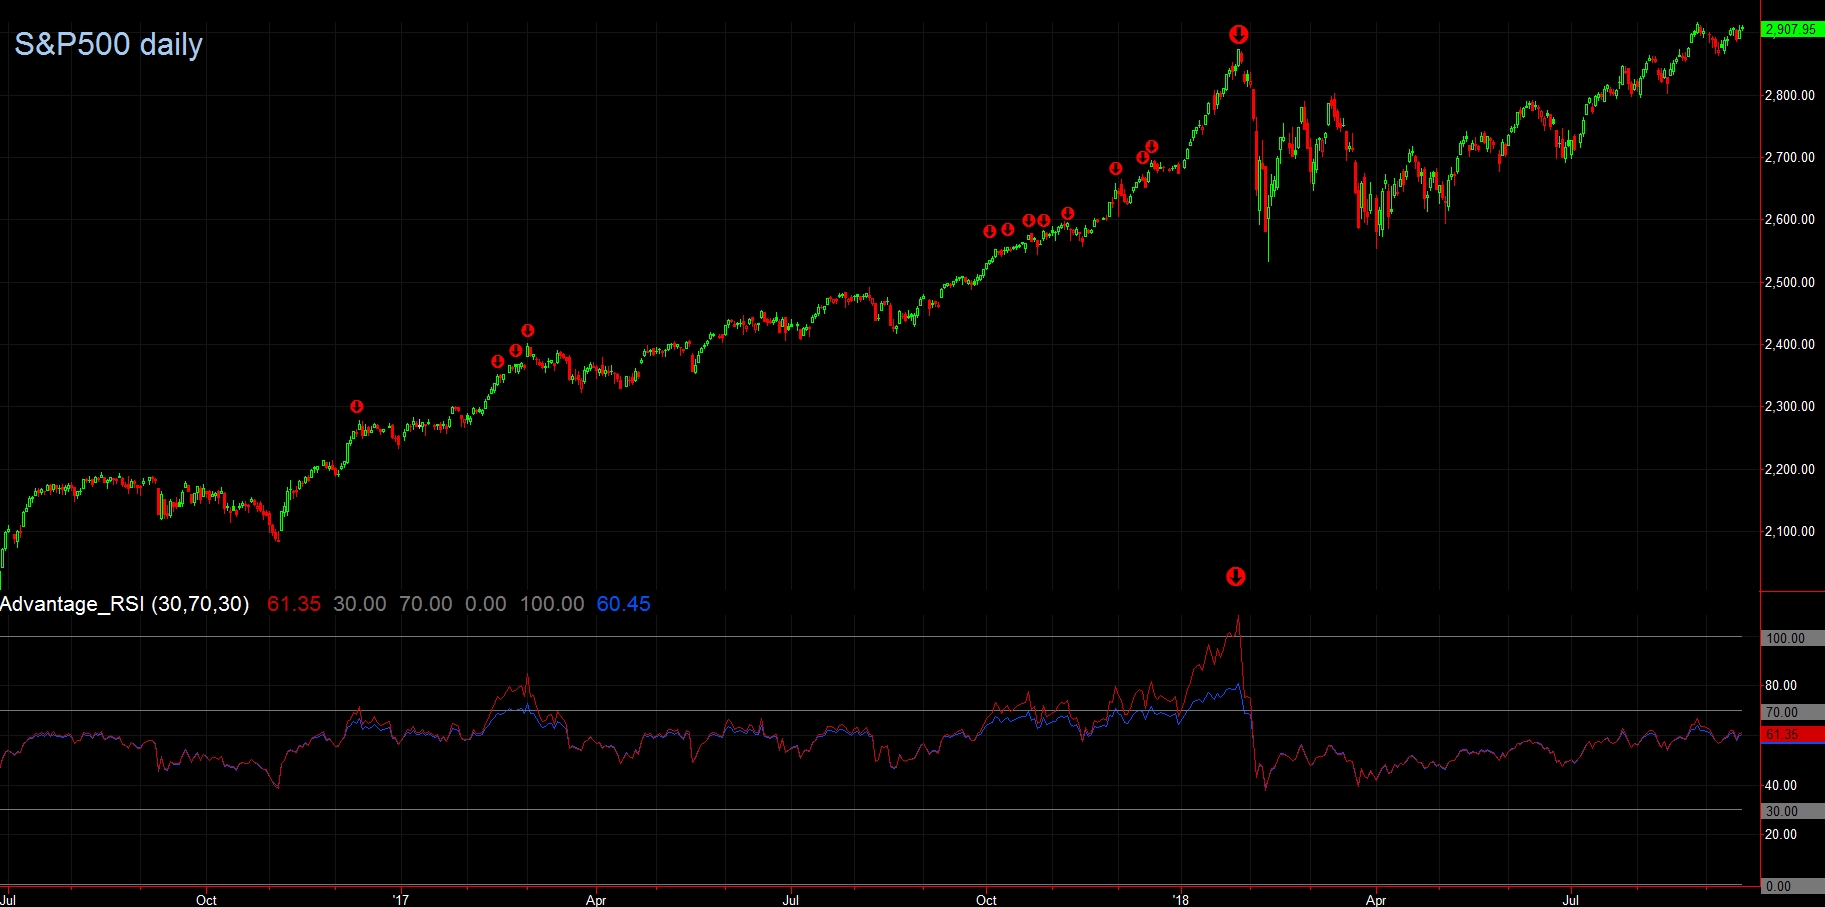
There is more trader can do with Advantage RSI than just to wait for it to cross 30/70 line. Since the readings are normalized it can be added, subtracted and averaged. Plus, used to develop more indicators. |